


.DZNhrkEv_1Vs2ty.webp)


The creation of my Computer Science Bachelors capstone using NodeJS, Raspberry Pi, Arduino, openFrameworks, and Processing.
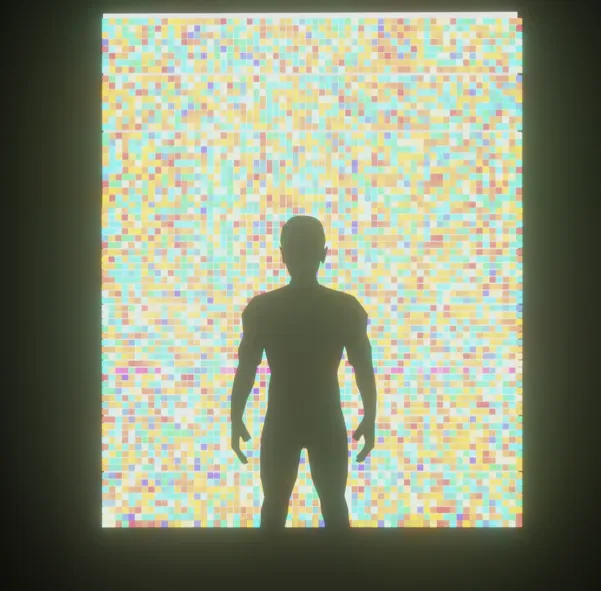
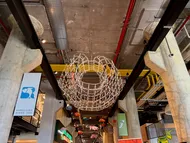
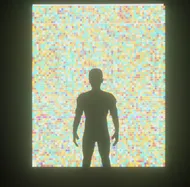
A render of my dream, a massive led grid maybe 10’ x 10’. Sigh, one day.
Initial Steps:
Initially, I considered using Twitter as a medium for interactivity. So I applied for developer access - but unlike the normal application if you are using this on behalf of a government you have to say so, and the form gets a lot longer. After stating what I was doing with the API, I received a follow-up email asking me to restate what I said. By that time over a week had passed and I moved the project in a different direction for interactivity. (Edit from the future: Twitter is now called X, owned by Elon Musk, and API access has gone away totally so… dodged a bullet and learned don’t rely on external platforms).
These are quotes from the initial idea document:
I want interactivity as opposed to passive sensors(like a temperature sensor because you can just ask your phone what the temperature is or look outside if it’s snowing). So, let’s make a bot(twitter) that takes in photos via an @ mention then cuts them into 3×3 grids(OR higher resolution grids 8×8, 16×16) then finds the dominant color in each “quadrant” then exports that to a LED light grid, with a screen saying who sent the photo. Then a webcam on the other side of the room takes a photo of it and tweets the photo and @’s the person who sent it.
This bypasses sensors entirely and forces people to interact with technology to see a physical manifestation of digital actions. By creating physical experiences we can break down the mystification of technology and create magic. We will also have a plaque/website saying in plain English how this works.
Flow:
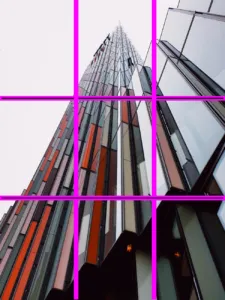
1. Tweet at the bot this image: (Author @unsplash)

2. The program will download the image then start to analyze it:
3. Then find the dominant color of each box in the grid:
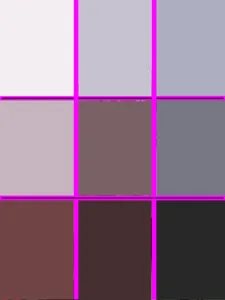
Then represent those colors on a grid of LEDs, and put the tweeter’s name on a screen.
3.a Then use a webcam on the other side of the room to take a picture of it and tweet out the photo and @ the tweeter.
Applying to Twitter for API access
To get an API key for Twitter you need to apply, with a specific requirement that you disclose if you are a government entity. This disclosure requirement caused major delays in my application and eventually its refusal.
Major pivot to the main idea – Midterm:
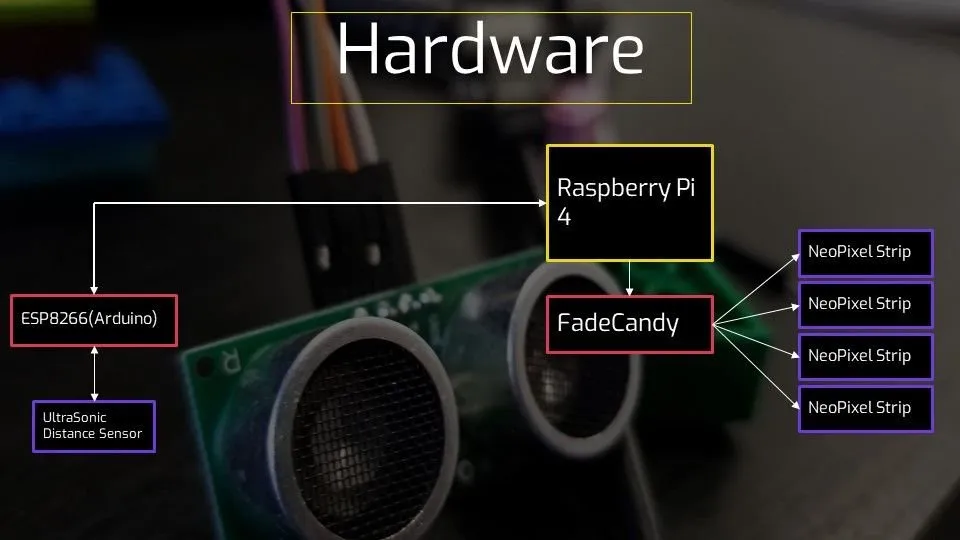
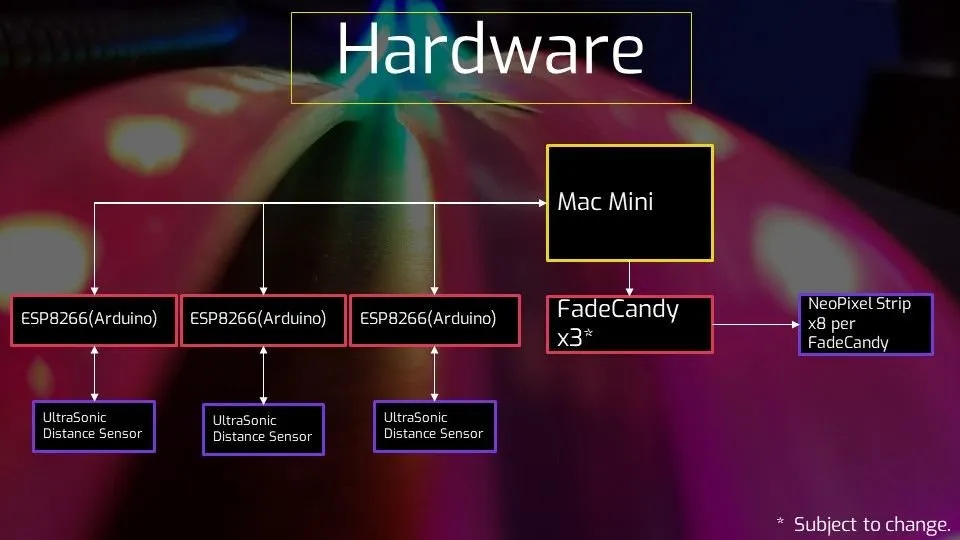
By this point the project hardware solidified into using a Raspberry Pi 4 as the master device and using Arduinos as sensor interfaces over the USB. The Raspberry Pi would control Neopixel LEDs using a FadeCandy a Teensy based Neopixel control USB board (Edit from the future: unfortunately the FadeCandy platform does not exist anymore):
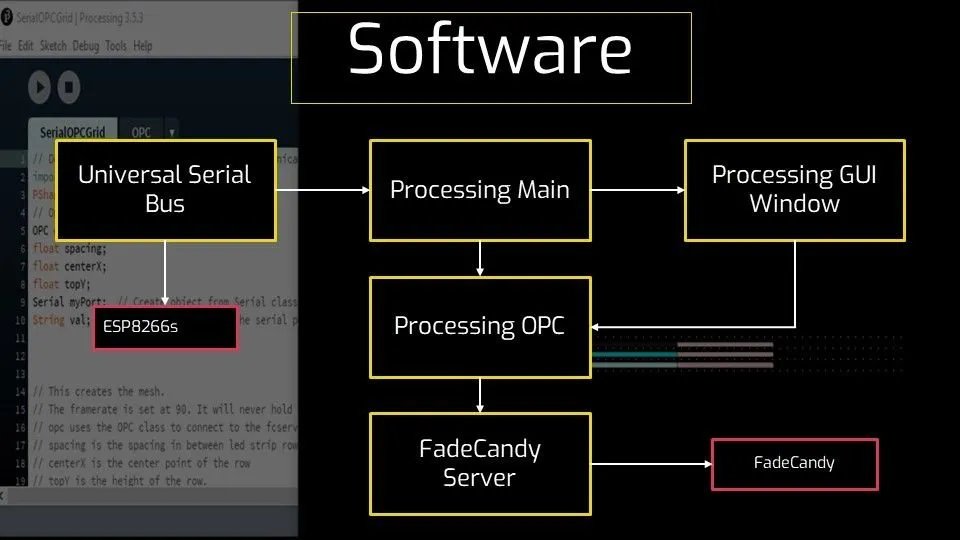
The initial application that ran on the RB Pi 4 was made using Processing a Java-based creative coding framework. I eventually moved from this due to low FPS when reading from the serial input and writing to the FadeCandy. The Processing library for the FadeCandy works by establishing points on the canvas to sample colors from the canvas. Those colors are then sent via the Open Pixel Control library to the FadeCandy server then that sends its data to the FadeCandy.
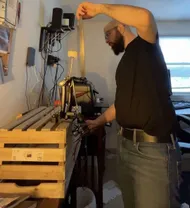
Example of distance sensor working:
Using ultrasonic distance sensors controlled via Arduino, receiving data into Processing program and led mapping distance.
In order to achieve my dream of a large led wall that still existed at this time I planned on moving the application to a Mac Mini and increasing the amount of FadeCandys to 3 and tripling the increasing the amount of NeoPixel strips to 24 strips. The FadeCandys can support 8 led strips. This did not happen.
The Midterm to Final:
Move toward openFrameworks:
This began my journey from my comfortable Java world to C++. I started to remake the program in OpenFrameworks 0.10.0 using XCode on Mac. Due to OpenFrameworks 0.10.0 not supporting the Raspberry Pi 4 I had planned on using a Mac Mini as the main hardware platform. Because this is C++ and not compiling for JVM each compilation needs to be done on the specific device you’re targeting. Eventually, OpenFrameworks 0.11.0 would be released and support the Raspberry Pi 4, which would end up being the final platform for this project.
Eventually, I was able to get to a point where I could control the position of boxes in openFrameworks (Mac) using 2 ultrasonic sensors as X / Y controllers.
During this time I also tried to make a standby animation using time as a variable to create a smooth gradient. This resulted in ~200 rectangles per rectangle. This was not added to the final product.
Time based animation of rectangles mapped to LEDs using openFrameworks.
Once the interaction of the sensors and the FadeCandy was complete I tried to add more IoT features: writing sensor data to a database and a website.
For the database I chose to go with AWS DynamoDB, a NoSQL database. I chose DynamoDB because it had a very generous free tier and I wanted to get experience using AWS.
For the website I made NodeJS Express Post endpoint that used a internal SocketIO connection to send new data received from the Post request to the client. I also created a really smooth pulsating green light that updated when the data was received. I wanted to make the site to give another way for someone not able to visit the instillation.
Final:
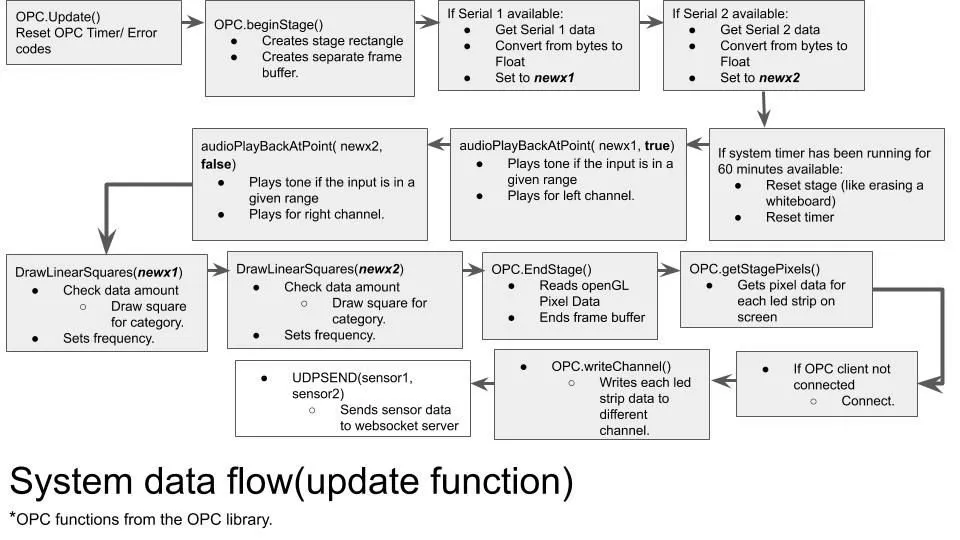
System data flow:
The data in the application is mainly gathered and passed around in the OpenFrameworks update function. First update the OPC function. Then restart the stage, which is essentially wiping the canvas. Then if Serial 1 is available get the data, convert bytes to float, and set it to newx1. Then if Serial 2 is available get the data, convert bytes to float, and set it to newx2. If the timer is >60 minutes reset timer and stage. Then it will play a predefined tone based on the newx1 amount, and newx2 amount. Then, it will draw the amount of squares using the linear squares for newx1 and newx2. Next, it will reach the stage pixels and send it to OPC FadeCandy. Then it will send the sensor data to the UDP socket.
The color data flow:
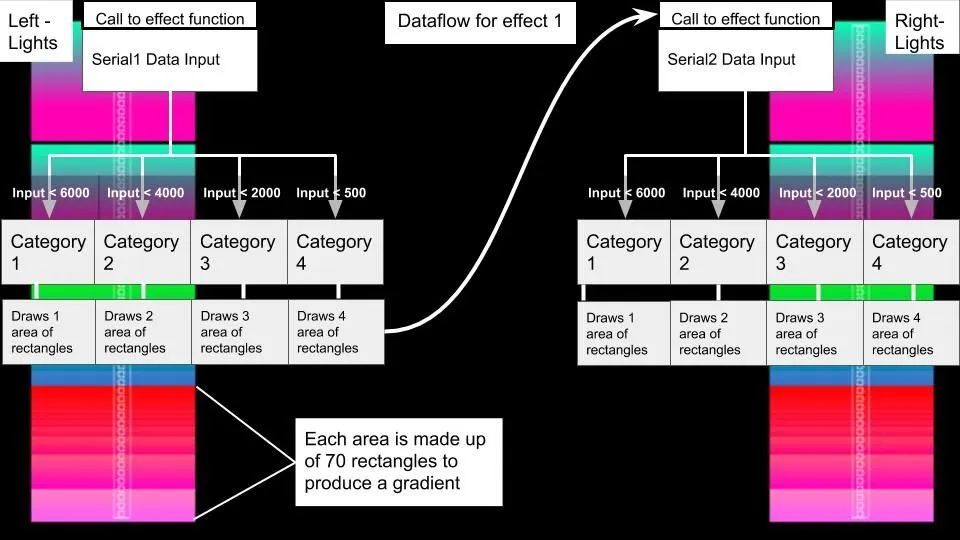
Ex. Left lights:
When a number is input it will check the amount and determine how many level of boxes will enraged. Each category will draw a “rectangle”. The lower the input amount the more rectangles will be drawn due to the distance sensors. This means the user is very close to the sensor. Each “rectangle” is made up of 70 rectangles to produce a gradient.
This shows both of the lights effect.
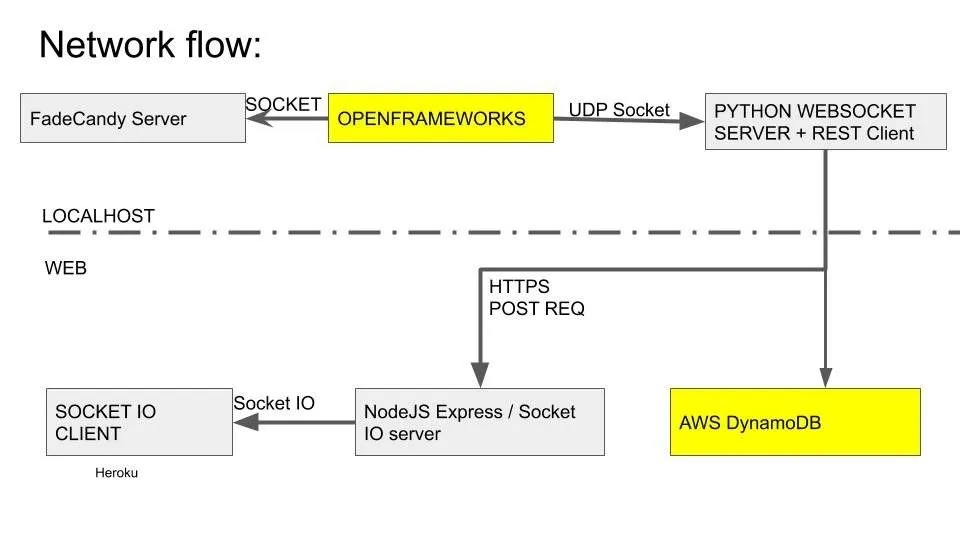
Network flow (openFrameworks):
How the OpenFrameworks application works it sends a UDP message of the data to a Python UDP Socket. The Python app sends that to a NodeJS app, and to AWS DynamoDB. The NodeJS app receives that data and sends it to an internal SocketIO room that the client site connects to. Note the Github link does not have the AWS DynamoDB write code, unfortunately I believe the only version exists on the Raspberry Pi.
Network flow (NodeJS):
Uses Express to create a REST API (Get for the website)
Get (/): returns the website
Post (/sendsensorsata) Receives the input JSON data from the Python app – Does input validation on the request – Validates key is equal to key stored as environment variable in NodeJS – Validates sensor1 and sensor1 are not undefined, numbers. – If the request is valid sends the sensor data to the socketIO client.
Wiring diagram:
The wiring diagram for the installation is very simple. The power distribution for the WS2812 NeoPixel LED strips is in parallel and the data lines are run to the FadeCandy. The ESP8266s are connected to the Raspberry Pi via USB to Serial cables. The distance senor have a trigger and echo connections as well as power and ground connections.
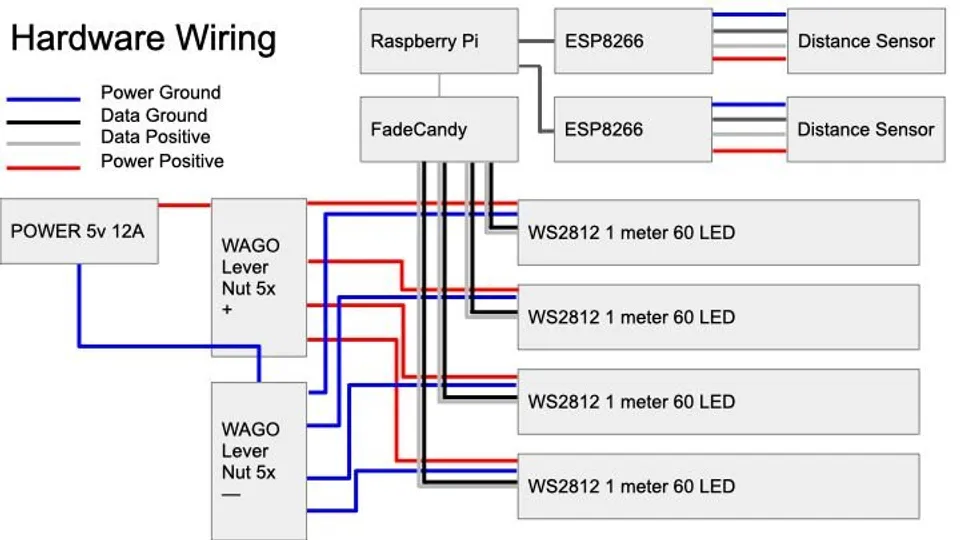
The hardware wiring for the installation. the led strips are ran in parallel from a 5v 12a power supply. the data lines are connected to a fadecandy. the esp8266s are connected via usb to serial cables, and the distance sensors are connected to trigger and echo pins, and power / ground.
Understandable definitions:
These are the definitions that were used to make the posters and make the technology used more accessible.
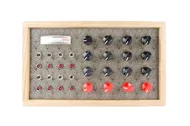
NeoPixels: These lights are like Christmas lights. Each light can be changed to a different color.
Arduino: This is a “microcontroller”. It’s a device that are told to do one thing and they do it forever. They are similar to how your cell phone works but instead of being able to run multiple apps at once, they can only run 1 app.
Distance Sensor: This allows the Arduino to tell how close you are. This is like motion detectors on garage lights, or automatic doors at your favorite retail store.
FadeCandy: This tells the light strip which individual lights to light up and what color. It’s like a remote for the lights but controlled from the computer.
Raspberry Pi: This is a very tiny computer. It works just like your laptop but is super compact. The computer runs a program that listens for the Arduino to say something – then tells the lights to light up.
Github: The main application: https://github.com/EdwardDeaver/SyracuseInnovationLEDProject