
When was my street plowed?
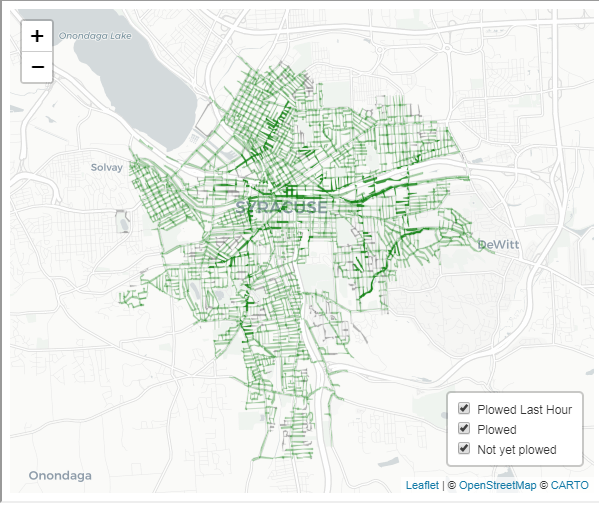
Syracuse Snow Plow Map
Introduction
In the beginning of 2018 Office of Accountability Performance and Innovation held a Civic Hackathon in partnership with Syracuse University’s iSchool to find insights on plow data. This project was a continuation of the mission of that hackathon to tackle our snow problem. The City of Syracuse’s snow plow mapping application is an in-house project, created by me (Edward Deaver, IV), a computer science intern with the City.
Snow plow mapping applications have been implemented by other municipalities within the region, and throughout the country:
Rochester, New York: https://gis.cityofrochester.gov/plowtrax/
New York City, New York: http://maps.nyc.gov/snow/#
Pennsylvania: https://www.511pa.com/
Before using a potentially expensive off-the-shelf commercial solution, we wanted to explore the potential of building a product ourselves. Going this route allowed experimentation and familiarization with cloud computing services that have become an integral part of technology infrastructure in the 21st century. If in the future a commercial product were to arise that had economic and feature benefits it would be considered.
Over the course of the latter half of the 2018 I proposed a system to tackle this challenge. It would talk to tracking devices on our snow plows, understand where they are, and relay that information to a website so anyone could see when their street was plowed. The idea was simple, but the execution of it was complex.
Timeline
The creation of the mapping software took the form of three parts: Planning, Development, and Deployment. Planning was a 3.5 month process, while Development took 2.5 months, and deployment is ongoing. The following post details the first iteration of the program.
Project Timeline
The proof of concept had 2 key parts:
Operate in near real time: showing streets being updated in 1 to 10 minute intervals. This posed the challenge of requiring specialized software to operate a geofencing server. The server would store geofences and be able to associate actions with them (i.e., if a truck enters the area, send a message with truck number).
The application had to be light on the user’s browser. Initial testing produced 10-20 megabyte web pages that would throw a “Page Unresponsive” error (Chrome, Firefox, Edge) on computers. This problem would be solved through using minified JSON files (as small as a JSON file can get) as data sources for a lightweight client to load and then store into memory, reducing the resources required for initial access.
Planning
Planning was a two-part process: Assessment and GIS research. Assessment started with understanding the capabilities of the Application Programming Interface (APIs) to which I had access. The first of those was our vehicle tracking API. The vehicle tracking API returns City vehicle locations as GPS coordinates: latitude, longitude. Translating those coordinates into a city street block is a two step problem. Using geofences, a polygon of coordinates that have an action attached to them, I was able to generate a geofence per city block and track when a vehicle encountered that fence.
Development
The development process took the form of a modified agile workflow with small proof of concepts being produced and eventually combined for a larger product. The development process was also an experiment for using Amazon’s AWS(EC2) as a development environment alongside using other Amazon services for the stack: DynamoDB(NoSQL) for the database and S3 for static site hosting (Like Google Drive, or Github).

The first step using the City Streets 2011 KML (file format used to display geographic data) found at data.syr.gov was to convert the four corner street addresses of a block for a CITYST_ID block into usable geocoordinates (geocoding). This created 4 unique points that could be combined to form a polygon shape for a specific city block. Then those pairs of points would be stored in arrays per CITYST_ID.
This process allowed the creation of visualizations of the geofences and filtering of them before they were implemented into a larger program. The program was designed so that the geofences were fed into a Geofencing server, Tile38, and then sent to a message broker, RabbitMQ. From there, a Python program would listen to the broker to make updates to a DynamoDB database.
In order for the system to map the street data coming from the server-side messages to the front end, the system must establish a universal primary key: CITYST_ID from the initial KML file. Within the DynamoDB database, the live street data had its own table with the primary key of CITYST_ID. The idea was Tile38 would have webhooks named after the CITYST_ID of the geofence they represented. So when the webhook was triggered the system would know a vehicle was in that geofence.
Another part was getting the data from the City’s Snow & Ice vehicles (this includes snow plows). This was fulfilled by a Python function that called all of the snow plow trucks, stored their data into an array, then created a minified JSON file of that data, and transferred it to the S3 bucket (similar to a folder in Google Drive). The client browser would load that and then store it in memory, reducing the resources required for initial access.
{"@type": "PagedGpsMessageResult", "index": 0, "limit": 1000, "count": 121, "total": 121, "gpsMessage": [{"messageTime": "2018-10-12T14:31:36Z", "satellite": false, "latitude": 43.055431, "longitude": -76.108658, "accuracy": {"@units": "MILES", "value": 0.006213711922373339}, "odometer": {"@units": "MILES", "@timestamp": "2018-10-12T14:31:36Z", "value": 2079.85}, "keyOn": false, "parked": false, "lastSpeed": 0, "avgSpeed": 0, "maxSpeed": 0, "vehicleId": 951175}, {"messageTime": "2018-10-12T15:06:51Z", "satellite": false, "latitude": 43.055716, "longitude": -76.10752, "accuracy": {"@units": "MILES", "value": 0.006213711922373339}, "odometer": {"@units": "MILES", "@timestamp": "2018-10-12T15:06:51Z", "value": 94543.3}, "keyOn": false, "parked": false, "lastSpeed": 0, "avgSpeed": 0, "maxSpeed": 0, "vehicleId": 955670}}]}
At one-minute intervals, the server-side portion of the system would call the Vehicle Tracking API to retrieve the location of the Snow & Ice vehicles. Once the data is retrieved, the VehicleID, Latitude, Longitude, MessageTime*, and currentEpochTime** for each vehicle would be uploaded to the Historical Vehicle Location table in our DynamoDB instance to create a historical record that could be reviewed at a later time. At 10 minute intervals the system would upload the API response as a JSON file to the AWS S3 bucket so anyone viewing the website could see where the trucks were at. The front end would load this JSON file and create a Javascript map object (key value pair array) that utilizes the VehicleID as a key. In the map it used this structure [ Key: VehicleID, Value: Leaflet Marker Object].
Once the backend architecture was taking shape, I moved onto the client-side part of the application. The client-side was designed to be light in terms of initial download. This created a few different consequences. While yes, the initial download would be an order of 75% lighter than a folium (leaflet map creation library) HTML file map, it generates all of its objects on the users’ device except for some assets stored on Content Delivery Networks (servers around the globe providing high-speed access to media or other assets). In all tests I conducted this method was faster. Loading a completed map (10mb-20mb file) would crash the Chrome instance I was using, and freeze the machine, because browsers are not designed to download excessively large HTML files, but they do well with gradual streams of data such as media files.
The front-end javascript loaded vehicle data from a JSON file stored on the S3 instance. The vehicle location data would be stored inside a map structure that associates vehicleID with a leaflet marker object for that ID. Ideally, the program would do that same process for street data, but that did not happen. The application also had a textbox where the user could enter their Syracuse street address, and then it would mark that address on the map, and zoom in; similar to Google Maps. This used the OpenStreetMap API to convert an address to geographic coordinates.
Deployment
Future me popping into this: hindsight is 2020 and now to deploy a Python application I would use Docker but I didn’t back when this was made. If you decide not to use docker to deploy a Python project deployment becomes difficult as you have to manage dependencies via virtualenv/requirements.txt. Just use Docker.